Supply is slowly increasing but there are signs that buyers are now biding their time.
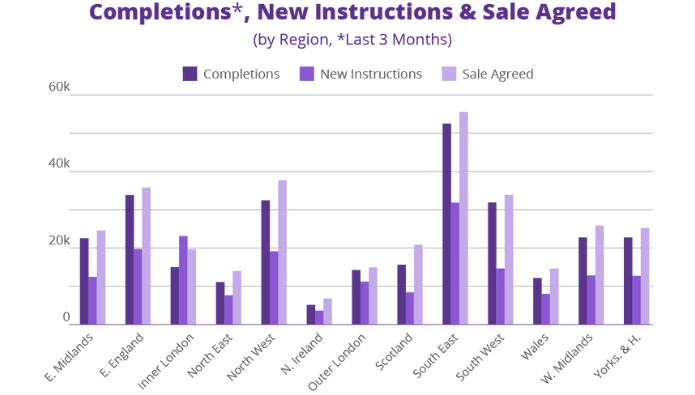
Analysis by property data company TwentyCi shows the number of new instructions is growing but the number of listings showing as sales agreed has slowed.
The analysis showed that overall new instructions increased by 4.63% in May compared with April, according to TwentyCi.
It said there are currently 188,017 properties listed for sale across the UK, with most in the south east of England.
Yorkshire and the Humber has seen a 7.3% rise in new instructions month-on-month, making this the most active region for property supply.
This is followed by the west Midlands with a 7.15% month-on-month increase, and the south west of England with a 7.06% month-on-month increase.
Other regions with notable new instruction activity are Wales, the east Midlands and the north west of England, which all had over a 5% month-on-month increase in new instructions.
At the other end of the scale, available properties in outer London stayed fairly static with just a 0.56% increase in comparison with April’s figures.
However, sales agreed have slowed, with just a 3.06% increase on April’s figures.
In contrast, there was a 39% monthly increase between March and April of sales agreed listings.
Currently, there are 340,125 properties across the UK with sales agreed.
TwentyCi said in its latest Homemover Pulse blog: “With more property supply coming to market and the cost of living increases, buyers may be biding their time before making purchase decisions.
Total completions in the three months to May have increased by 12.95% when compared with the previous month’s figures, according to the research.
There have been 297,761 contract completions across the UK in the three months to May, TwentyCi said.

Property data and estate agent prospecting platform Homesearch analysed its property data to find out which agents, by postcode area, have experienced the best or toughest market conditions.
It found that estate agents in Wigan have seen a 22% fall in year-on-year sales volumes, ranking them in top position among the top 10 lowest performing areas out of more than 100 major postcodes analysed.
This contrasts with Harrogate in Yorkshire which is the best-selling area for agents outside of the capital and has experienced an 11.5% annual increase in sales transactions for the same period.
Wigan ranked in 98th position nationally, with more than £533m of property sales generated by agents in the town in the past 12 months.
The research found that Wigan estate agents have benefited from a 6.9% (£11,561) increase in average house prices year-on-year.
This rise ranks the town in 100th position nationally in terms of the size of the price increase, with 96% of areas having seen an uplift in sale prices.
Speed of sale is also key to estate agent businesses in Wigan, with local properties taking 46 days on average to sell subject to contract from the date they went on the market, underlining the low level of supply.
This compares nationally to Slough where properties take 71 days to sell – the slowest time period outside of London.
Sam Hunter, co-founder and chief operating officer at Homesearch, commented: “It’s very clear from our data that the housing market in Wigan presents the toughest battleground for estate agents outside of London.
“At a time when the national picture is buoyant and house prices have risen significantly in the last 12 months, the challenge facing agents in Wigan is mainly due to a chronic shortage of sellable housing stock, with 29 buyers on average competing for every one property on the market.
“Local agents will clearly have to work harder than ever to stimulate the market and win new instructions if they are to address this sizeable drop in sales transactions.”
|
Biggest |
Lowest |
|
1. Harrogate: +11.5% (386 homes) |
1. Wigan: -22.2% (854 homes) |
|
2. Slough: +7.2% (257 homes) |
2. Telford: -21.9% (623 homes) |
|
3. Canterbury: +7% (461 homes) |
3. Manchester: -19.2% (2,472 homes) |
|
4. Llandrindod: +6.6% (565 homes) |
4. Durham: -17.9% (669 homes) |
|
5. Halifax: +5.9% (114 properties) |
5. Preston: -17.6% (1,307 homes) |
|
6. Torquay: +4.1% (192 properties) |
6. Sheffield: -17.3% (2,810 homes) |
|
7. Southend: +4% (267 properties) |
7. Liverpool: -16.8% (1,456 homes) |
|
8. Brighton: +3.8% (426 properties) |
8. Huddersfield: -16.4% (571 homes) |
|
9. Tonbridge: +3.3% (338 properties) |
9. Newcastle: -16.3% (2,278 homes) |
|
10. Hemel Hempstead: +3.3% (215) |
10. Stoke: -16.3% (1,342 homes) |
